SwarmOps
It started as my capstone project, and it is the closest thing to my interest in defense tech.
- AWS EKS
- Terraform
- Argo CD
- Helm
- GitHub Actions
- Argo Rollouts
- Prometheus
- Grafana
- Loki
The problem
SwarmOps is a drone fleet mission planning platform with real-time dynamic re-planning. Given drones with limited battery and a list of missions, it assigns drones to missions, computes routes the battery can actually fly, avoids no-fly zones, adds charging stops, and re-plans when conditions change, all shown on a live operator map. The drone fleet is simulated.
On the platform side, the problem was shipping nine services from separate repositories to one Kubernetes cluster, safely and repeatably, and being able to see what each of them was doing once it was running.
Architecture
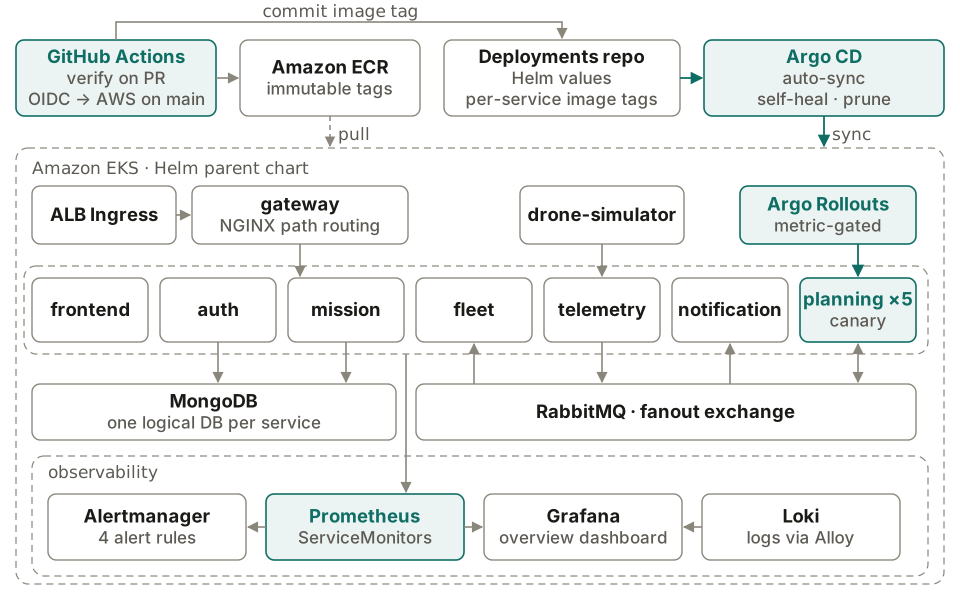
Operators reach the system through an AWS load balancer, the only public entry point, and an NGINX gateway that routes by path to the services: auth, fleet, missions, planning, telemetry, notifications and the React frontend. A drone simulator flies the assigned routes and reports telemetry. Telemetry is published to RabbitMQ, where the fleet service updates each drone's position and battery and the planning service re-solves on low-battery and mission-complete events, backed by a 30-second reconcile loop. Each service has its own logical database in MongoDB.
Delivery is GitOps. On a merge to main, a service's GitHub Actions workflow authenticates to AWS through OIDC, builds an image with an immutable tag (version plus git hash, never latest), pushes it to ECR, and bumps that one service's image file in a deployments repository. Argo CD watches that repository and syncs one parent Helm chart to EKS with auto-sync, self-heal and prune. The planning service, the highest-risk one, ships through an Argo Rollouts canary: 20%, then a Prometheus analysis, 50%, another analysis, then 100%. The analysis checks the canary pods' 5xx rate and p95 and p99 latency.
The cluster is provisioned with Terraform: a VPC, an EKS managed node group on Spot instances, ECR with immutable tags and scan on push, and the IAM role GitHub Actions assumes. Every backend service exposes Prometheus metrics and writes structured JSON logs, which Grafana Alloy ships to Loki.
What I built
- I built and operated a nine-service system on AWS EKS as part of a three-person engineering team, shaping the architecture, cross-service contracts and review process across a twelve-repo polyrepo.
- I owned delivery end to end: a Terraform-provisioned cluster, one parent Helm chart generating the near-identical services, Argo CD GitOps with auto-sync and self-heal, and GitHub Actions CI/CD authenticating to AWS through OIDC with no static keys.
- I wrote the Argo CD Application and AppProject, and bootstrapped Argo CD from Terraform so Argo CD and its applications are installed by Terraform instead of by hand.
- I split the Terraform state into a persistent part (ECR, the OIDC role) and a cluster part, so the cluster can be destroyed between sessions to save cost without deleting the image registry or CI access.
- I ran Argo Rollouts canary releases on the highest-risk service, and instrumented every service with Prometheus metrics, Grafana dashboards and Loki log aggregation, which is how the multi-replica race conditions got caught. That includes four alert rules and a "SwarmOps Overview" dashboard covering request rate, error rate, latency and the planner's own metrics.
- I built the core data services: auth (JWT issuance and roles), fleet (drones, no-fly zones, charging stations, and the telemetry consumer) and missions.
Decisions and trade-offs
A deployments repo as the source of truth. CI never deploys to the cluster directly. It only edits one image file in Git, and Argo CD does the rest. Self-heal reverts any change made by hand, and every release is a commit I can read or revert.
Immutable tags, OIDC, no static keys. Image tags can never be overwritten, so what runs is always traceable to a commit. GitHub Actions gets short-lived AWS credentials through OIDC instead of stored access keys.
A map instead of a list in the Helm values. Helm replaces lists wholesale when it merges values files, so per-service image files would have overwritten each other. I converted the services list into a map so each image file merges in cleanly.
A canary only where the risk is. The planning service makes the decisions, so it is the one that gets a canary. There is no traffic router in the cluster, so the canary split is approximated by replica count across its five replicas. That is coarser than weighted routing.
Destroyable cluster, persistent essentials. Spot nodes and a cluster that can be torn down between sessions keep the cost down, while the registry and the CI trust relationship survive every destroy.
What went wrong and how I fixed it
Five replicas, one solve. The planning service runs five replicas, and the new 30-second reconcile loop would have let all five run the solver at the same moment. I added a Mongo-backed solve lock with a TTL, taken through a conditional update, so only one replica solves at a time.
The lock passed the tests and crashed on real Mongo. The tests ran against a fake database, which kept time zones on datetimes while real MongoDB returns them without. I found it by running the demo scenarios against the real Docker Compose stack, fixed the comparison, and made the fake strip time zones the same way Mongo does.
The auth service crash-looped. During a cluster health sweep I saw the auth pod restarting and read the crashed container's output with kubectl logs --previous. Registration did a check-then-create, so concurrent registrations raced and the second one hit MongoDB's duplicate key error, which crashed the process. I made it catch that error and return 409 Conflict.
Bootstrapping Argo CD from Terraform. A single Terraform run could not plan Argo CD resources before their CRDs existed. I split it into two Terraform Cloud workspaces joined by a run trigger, so the second workspace only plans after the first has applied.
Results
- 9 services running healthy on AWS EKS in live verification.
- All 9 service pipelines publishing through OIDC, with 87 automated image bumps in the deployments repo.
- In a canary rehearsal with injected faults, the Prometheus analysis measured about 35% errors on the canary, failed 3 measurements against a limit of 2, and aborted the rollout while the 5 stable pods kept serving.
- Observability across the backend: metrics, structured logs in Loki, 4 alert rules and one overview dashboard.